

10 Best Solar Energy Solutions for Global Buyers?
Global buyers are entering a solar market that is expanding quickly, but not uniformly. The International Renewable Energy Agency reported 585 gigawatts of renewable capacity additions in 2024. Solar photovoltaic systems represented approximately 452 gigawatts, or 77% of new renewable capacity. These figures show strong momentum, yet they do not guarantee the right solution for every project.
This guide examines 10 best solar energy solutions for global buyers, from rooftop photovoltaic kits to utility-scale battery systems. The International Energy Agency expects solar PV to remain the largest source of renewable capacity growth through 2030. However, equipment quality, local sunlight, grid reliability, import duties, and after-sales service can change the real return. A panel performing well in Dubai may need different mounting, cooling, or cleaning plans in coastal Brazil.
Details matter. Buyers should compare module degradation rates, inverter efficiency, warranty terms, fire certifications, and supplier testing records. Independent standards, including IEC 61215 and IEC 61730, provide useful reference points for module durability and safety. The World Bank’s Global Solar Atlas can also support early resource assessments before purchase decisions.
No ranking fits every market. That limitation matters. A low purchase price may hide weak technical support or costly replacement parts. Even experienced buyers can overlook installation training and local maintenance capacity. Therefore, this overview focuses on measurable performance, practical deployment experience, supplier credibility, and long-term ownership risk. The best option is not always the newest product. It is the solution that remains dependable after years of heat, dust, rain, and changing energy prices.
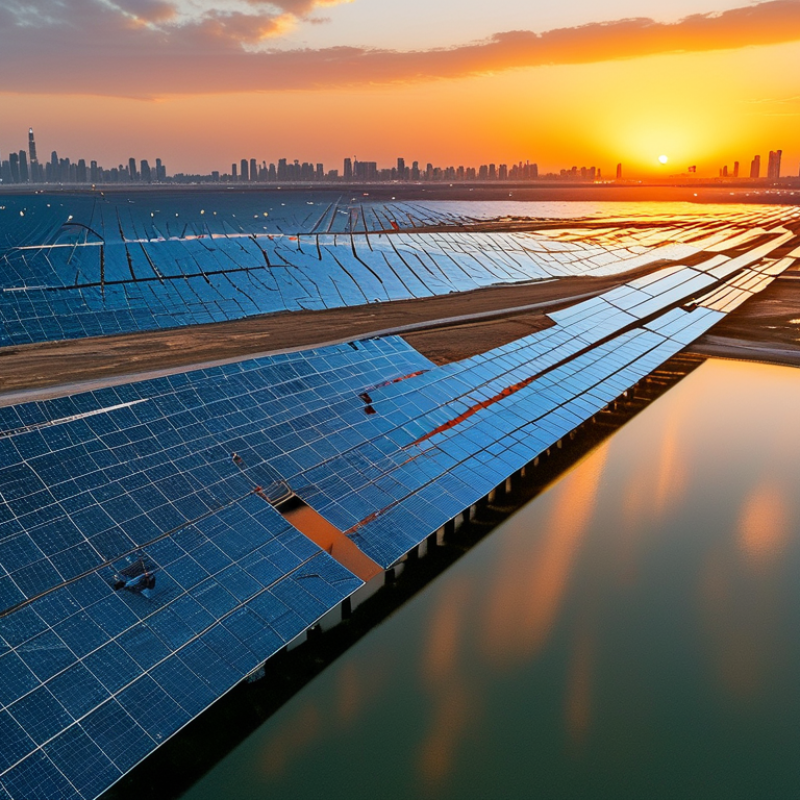
Solar Energy Solutions by Application, Scale, and Energy Demand
Solar energy solutions should begin with the application, not the panel count. Homes often need rooftop systems for lighting, refrigeration, water pumping, and evening appliances. Small businesses may require daytime power for workshops, cold storage, or communication equipment. Remote clinics need dependable electricity for vaccine refrigerators and medical devices. Start with the load.
Scale changes the engineering approach. A small off-grid system may combine solar panels, batteries, and a backup generator. A commercial installation often needs three-phase power, protective equipment, monitoring, and space for maintenance access. Utility-scale projects demand land studies, grid assessments, drainage planning, and environmental permits. Local electrical codes must guide every design.
Energy demand also changes by hour and season. A school may consume most electricity during daylight, while a household often peaks after sunset. Battery capacity should reflect measured demand, not optimistic estimates. In practice, buyers should request a load audit, production simulation, warranty terms, and installer qualifications. Ask how the system performs during heat, dust, storms, and weak-grid conditions. Clouds matter.
A technically sound system can still disappoint if cleaning access is poor or replacement parts take months to arrive. I have seen oversized batteries increase cost without improving daily reliability. That is not failure, but it deserves reflection. Buyers should compare lifecycle cost, expected degradation, safety controls, and local service capacity before approving a design.
| No. | Solar Energy Solution | Primary Application | Typical System Scale | Typical Energy Demand | Indicative Annual Energy Output | Recommended Storage or Backup | Best-Fit Locations | Key Buyer Considerations |
|---|---|---|---|---|---|---|---|---|
| 1 | Residential Rooftop Solar PV | Household electricity, lighting, appliances, cooling, and electric-vehicle charging | 2–15 kWp | Low to medium; usually follows morning and evening household loads | Approximately 2,400–22,500 kWh per year, depending on system size, sunlight, orientation, and losses | Optional lithium-ion battery, commonly 5–30 kWh; grid connection or generator may provide backup | Homes with suitable roofs and reliable solar exposure in grid-connected or weak-grid areas | Roof condition, shading, local grid rules, export limits, battery cost, safety certification, and installer quality |
| 2 | Commercial and Industrial Rooftop Solar PV | Factories, warehouses, offices, retail buildings, cold storage, and daytime industrial processes | 50 kWp–5 MWp | Medium to high; particularly suitable for stable daytime consumption | Approximately 60,000–7,500,000 kWh per year, based on regional solar yield and system performance | Optional battery storage, demand-management controls, or grid backup | Commercial roofs, logistics centers, manufacturing sites, and facilities with high daytime loads | Structural loading, roof lease period, power-quality requirements, self-consumption ratio, and interconnection capacity |
| 3 | Utility-Scale Solar PV Farm | Bulk electricity generation for utilities, power purchasers, and large energy portfolios | 10 MWp–1 GWp+ | Very high; designed for wholesale electricity supply and long-term power contracts | Approximately 12–1,800 GWh per year, depending on installed capacity and local solar resource | Grid-scale batteries, typically 1–4 hours of rated power, may shift output and provide ancillary services | Large areas with strong solar irradiation, available transmission, and suitable land-use conditions | Land rights, permitting, grid congestion, curtailment, financing, environmental assessment, and module degradation |
| 4 | Solar-Plus-Storage Microgrid | Reliable electricity for remote communities, campuses, resorts, clinics, public facilities, and critical loads | 10 kWp–10 MWp | Low to high; can serve essential loads continuously when properly sized | Approximately 12,000–18,000,000 kWh per year, depending on PV capacity and local solar conditions | Battery energy storage, energy-management system, and optional diesel, biofuel, or grid backup | Weak-grid, off-grid, island, rural, humanitarian, and energy-resilience applications | Load prioritization, battery replacement planning, cybersecurity, local maintenance, spare parts, and black-start capability |
| 5 | Solar Water Pumping System | Irrigation, livestock watering, municipal water supply, and borehole pumping | 1–500 kWp | Variable; generally highest during daylight and irrigation seasons | Approximately 1,200–750,000 kWh per year, subject to pump efficiency, water head, and operating hours | Water storage tanks are usually more economical than electrical batteries; batteries may support night pumping | Sun-rich agricultural areas and remote water sites with limited fuel or grid access | Water-table sustainability, borehole yield, pump sizing, dry-run protection, filtration, and theft prevention |
| 6 | Solar Water Heating | Domestic hot water, hotels, hospitals, laundries, food processing, and other thermal loads | 2–1,000 m² collector area | Low to high thermal demand; most effective where hot-water consumption is regular | Approximately 700–700,000 kWh of useful heat per year, depending on collector area and climate | Insulated hot-water storage tanks; auxiliary electric, gas, or biomass heating may be used | Residential, hospitality, healthcare, and industrial facilities with suitable solar exposure | Hot-water profile, water quality, freeze protection, scaling control, roof loading, and maintenance access |
| 7 | Agrivoltaic Solar Systems | Combined crop production, grazing, shade management, and electricity generation | 100 kWp–100 MWp | Medium to high; electricity production is combined with agricultural activity | Approximately 120,000–180,000,000 kWh per year, depending on capacity, spacing, and solar resource | Optional battery storage, irrigation controls, or grid connection | Farmland where crop, livestock, or horticultural operations can coexist with elevated PV structures | Crop tolerance to shade, machinery access, water management, structural height, land rights, and agricultural yield monitoring |
| 8 | Floating Solar PV | Power generation on reservoirs, water-treatment ponds, irrigation basins, and former industrial water bodies | 1 MWp–500 MWp | High; suitable for utility or large commercial electricity demand | Approximately 1.2–900 GWh per year, depending on plant size, waterbody conditions, and solar irradiation | Optional grid-scale battery storage or direct integration with nearby hydropower assets | Suitable inland water bodies with stable water levels and nearby grid infrastructure | Water-level variation, anchoring, wind and wave loads, ecological impact, corrosion, access, and electrical safety |
| 9 | Solar Thermal Process Heat | Food and beverage processing, textiles, chemicals, mining, desalination, and district heating | 0.1–100 MWth | Medium to very high thermal demand, especially at low and medium temperatures | Approximately 150–150,000 MWh of useful thermal energy per year, depending on collector field and operating conditions | Thermal storage tanks, heat-transfer fluid storage, and auxiliary boilers for periods of low solar availability | Industrial sites with consistent heat demand and strong direct solar radiation | Required temperature, process integration, available land, thermal storage, backup fuel, and seasonal demand variation |
| 10 | Solar Carports and EV Charging | Parking areas, fleet depots, workplaces, retail centers, public facilities, and electric-vehicle charging hubs | 50 kWp–10 MWp | Medium to high; charging demand can be managed to match solar production | Approximately 60,000–15,000,000 kWh per year, depending on PV capacity and local solar yield | Smart charging, stationary batteries, or grid backup; vehicle-to-grid operation may be available where regulations permit | Sites with large parking areas, daytime vehicle dwell time, and adequate electrical capacity | Canopy structure, drainage, accessibility, charger power, demand charges, fire safety, and future vehicle growth |
Related Posts
-
What is Solar Energy Projects and How Do They Benefit the Environment?
-
10 Tips for Successful Solar Energy Adoption
-
10 Essential Tips for Choosing Solar Energy Equipment for Your Home?
-
2026 Top Solar Energy Technology Trends You Should Know?
-
Top Solar Energy Panel Trends in 2026 for Global Buyers?
-
What is a Solar Battery System and How Does it Work?


